Excerpt
Reasons for receiving low profit margins by the smallholding farmers though the farmgate price of rice is high: A case study of farmers in the Municipality of Calumpit of Philippines
M Mizanur Rahman1 and Tasfi Sal-sabil2
Using a case study approach, this article explores why the smallholding rice farmers in the Philippines receive low profit which is even as less as the minimum wage when the retail price of rice is significantly higher in comparison to those of nearby countries. In the Calumpit municipality of Bulacan province of the Philippines, the study uses mixed design with both qualitative and quantitative tools. It is a general perception that presence of middlemen in the rice value chain minimizes the profitability of the farmers but in Philippines, the scenario is not the same. This study explains how the limited or almost no access to the factors of production can make the smallholding farmers dependant on the other actors who eventually extracts the major profit share from the value chain. It also emphasizes on the promotion of multi-cropping by making water and other inputs available for farming, which eventually can make smallholding farming profitable in the study area.
Key words: Agriculture, smallholding farmers, rice farmers, poverty, profit, middlemen
INTRODUCTION
Why the country where the International Rice Research Institute (IRRI) was established in 1959, is now a net importer of rice is a paradox. Rice is a popular diet in Philippines and apart from being a food staple, it is also an important economic commodity. Smallholding farms of this country not only meet the food demand of the country but also create employment opportunities for approximately 80 percent of rural people. Although in the 70s, with the spread of the green revolution, the country had experienced a significant growth in agricultural production and attained food sufficiency; in recent years it has turned into a rice importing country.
Smallholders often have limited access to markets for both inputs and outputs, and this has a significant effect on their production activities (Fan et al., 2013). On the other hand, they suffer from high production cost. In developing countries, increasing input costs for fertilizers, pesticides, price of electricity and diesel have frustrated farmers. As a result, many farmers are being pushed either toward cash crop production (which does not contribute to national food security) or out of agriculture altogether. Rahman et al. (2012) analyze the case of Bangladeshi small rice farmers and note that in the face of rising production costs and low returns from production, retaining smallholding farmers in rice production is a challenge in many developing countries. In Philippines, both the farmgate price and retail price of rice is higher than that of the neighboring countries like Vietnam and Thailand but still the small farmers are not happy with the profit they gain from rice production here.
However, the current major rice exporting countries are those which are located within the Asian landmass, largely irrigated by rivers. These countries are mainly Thailand, Vietnam, Cambodia, and Myanmar, those which are traversed by the mighty Mekong River. Many of the land areas of these countries are irrigated naturally i.e. rain fed and irrigated from river throughout the year and so they enjoy some comparative advantages for rice production and have lower production cost in comparison to many other countries.
A few years ago, the Philippines was also one of the rice exporting countries but now it is a net rice importing one. There are several reasons for this; the first is agricultural price policies. Agricultural price policies have a significant role in determining rice price and also rice production of a country. As a state, the Philippines has not been successful in controlling or influencing rice production or in setting (fixing) rice prices. Although, between the 1940s and 1970s there was a new rice production regime in terms of boost in production spurred by land reforms and the green revolution, the National Food Authority (NFA) could not regulate rice price in recent years (as it did as recently as between 1990 to 2009). In recent years, the NFA had been able to procure less than 2 per cent of the total rice production of the country (Tolentino and Pena, 2011). Governments need to maintain a balance between the interest of the poor rice producers and the poor non-producers, who seek higher rice prices, and those who are largely the landless and urban poor consumers, who need low rice prices. This is the reason why the NFA adopted the policy to ‘buy high and sell low’, thereby benefiting both producers and consumers. It bought rice from farmers with a higher price and sold to poor consumers at low prices via rice subsidies. But due to having less capacity, the volume of procurement of NFA was very small in comparison to net production. It could not really have a substantial impact on the market and eventually, the rise in the domestic production of rice lowered the rice prices and farmers were dis-incentivized.
In recent years the growth rate of rice production in the Philippines has been slower in comparison with that of population. Moreover, the demand for rice has increased as the income level of people has risen and it creates extra demand for different types of foods that are processed from rice. In 1995, when Philippines acceded to the World Trade Organization (WTO) and promised to remove all quantitative restrictions and reduce tariff protection, scope was created to import rice to meet the increased level of demand and this is how, the country moved to be rice importing one though, both yield and cultivation area have also risen over the years resulting to a higher production. From 2004 to 2014, the cultivated area rose from 4100 ha to 4692 ha as the IRRI (2014) data indicates.
Despite the series of institutional rearrangements, the achievement of Philippines in terms of food security is disappointing. From 1998 to 2009, the percentage of people suffering from hunger has risen from 10% to 24.2% (Tolentino and Pena, 2011). This raises questions about why despite the government’s declarations to eliminate hunger; it gradually worsened in this country. A key problem is the price of rice, which is significantly higher in Philippines than that of other countries.
In this paper we examine the reasons for the disincentives served by changes in rice price policy and squeeze on the profits of farmers through high costs of production and un-decent value chain relations between traders and farmers. We attempt to explain why smallholding rice farmers receive low margin using the case study of the Municipality of Calumpit in the Philippines.
METHODOLOGY
Study area
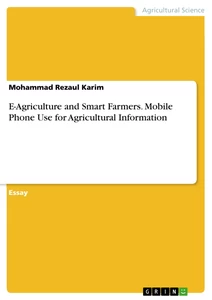
Based on the concentration of rice farming, the study has selected five barangayas i.e. Gugo, Longos, San Jose, San Miguel and Santa Lucia of Calumpit Municipality of Bulacan (as shown in Figure 1). The municipality of Calumpit is strategically located with three exit and entry points from North Luzon Expressway, Tabang, Sta Rita, Pulitan Exit. This is generally characterized by flat ground surface with the whole municipality having slopes from 0 to 3 percent. Available data indicates that out of the total 5,625 hectares, 5,434.31 hectares or 96.61 percent land area fall under 0-20 meters evolution. This is because of the town’s
illustration not visible in this excerpt
Figure 1: Map of Calumpit Municipality
Source: http://www.calumpit.gov.ph/images/ barangay/administrative%20map_1.jpg
priority of the Manila Bay Area. And thus, this plain land is a fertile and suitable land for rice cultivation. (Municipality of Calumpit, 2014).
The soil of Calumpit is classified as Bigas Clay loam consisting of 184513 hectares of land area of which 3.27 percent, Quingua silt loam with 3790.72 hectares or 67.39 of total area. The Quingua loam has solum depth of over 50 cm and has a loose silt loams topsoil and a slightly composed of heavy silt subsoil and a slightly compact clay loam. This soil has low organic matter content and moderate natural fertility. The available plea porous content is adequate for both upland crops and especially rice (Municipality of Calumpit, 2014).
At the Municipality of Calumpit, maximum land area of 67.66% is used for agricultural production while residential area,rivers and creeks cover more than 10% each. Land area and population of the five selected barangayas area is given in Table 1.
Table 1: Statistics of population and land area
illustration not visible in this excerpt
Source: The Municipality of Calumpit, 2010
Sample size and tools of the study
The study adopted a mixed design with the mixture of quantitative and qualitative tools. For the survey, stratified random sampling was used and it gathered specific and detail information on production costs, average farmgate price etc. The list of farmers in these villages was collected from Municipality Agricultural Office (MAO). For selecting respondents we followed two inclusion criteria- research participants must be a small holding rice farmers and for whom rice farming is the primary income source. Based on these two criteria, we found out that 115 farmers meet both of our requirements. The farmers who did not meet both or any of the requirements were excluded. Finally, out of those 115 farmers, 50 have been selected randomly from five villages 10 from each.
Apart from this, five barangay captains were interviewed with a semi-structured questionnaire and five Focus Group Discussions (FGDs) were conducted in all the selected villages. Participants of the FGDs were randomly picked among the villagers. All the participants of the FGDs were either rice farmers or having good knowledge about the current situation of rice farming at that area. In the interviews, the questions were set to understand the detail of the situation under which the smallholding farmers are obliged to sell their productions to some particular people and also to understand the relationship among the actors in the value chain of rice at the study area. FGDs were helpful for having a better understanding of the agricultural market and current challenges facing farmers in regards to rice farming and marketing. FGDs were also used to get the data for value chain analysis and seasonal calendar. The total number of the FGD participants was 64 where 56% were female and 44% were male.
Scenario analysis of rice production in Philippines
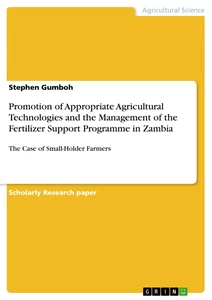
The country produced 10.64 million tons of milled rice from 4.56 million hectares in 2011, based on an average yield of 2.33 tons per hectare. In the last decade, the total harvested area in the Philippines has increased steadily (Figure 2). Likewise, the total rice production grows at 2.08% annually, 1.73% of which comes from yield improvement and 0.34% from an increase in area harvested. Total rice consumption (12.39 million tons in 2011) grows at 1.54% per year due solely to population growth, as per capita consumption declines by 0.23% annually. Despite projected gains in rice output, the country is expected to remain a rice importer over the baseline period as the population continues to grow and a safe level of stocks is maintained for food security (Wailes and Chevez, 2012)
In the same way the total rice production of the country has increased steadily. According to IRRI (2014), rice production of the country has increased from 14,500 tons to 18,016 from 2004 to 2012. Only in 2009, this steady growth was hampered as
illustration not visible in this excerpt
Figure 2: Total harvested area (Ha)
the Philippines suffered from an El Niño-induced drought, drying up watercourses and irrigation systems in some of the most productive rice areas in Luzon (Redfern et al, 2012)
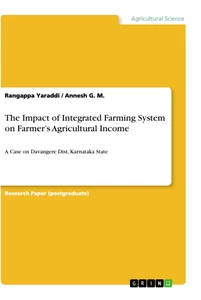
On the other hand, the farm harvest price has also increased over the years. According to the IRRI (2014), the farm harvest price of rice has increased by 8% in every year in an average from 2004 to 2012 (Figure 3). But it is important to note that during this time, the economy of Philippines experience an inflation rate 5.03% in an average. So, it can be said that, the income of the farmers did not increase significantly during the last decade.
illustration not visible in this excerpt
Figure 3: Farm harvest price PHP/MT
Value chain analysis of rice at Calumpit municipality
There are broadly six main stakeholders in the value chain of rice as shown in the Figure 5. After farmers harvest their rice, small traders buy it and sell it on to the big traders who are often involved with rice processing. This year, the non-processed rice price was sold from 22 to 24 Philippino Peso (PHP) per kilogram (kg). If the rice quality is very good, small traders pay them 24 PHP when lower quality rice gets 22 PHP per kilogram. In the field it has been observed that in many cases, the small traders fix the price and they try to establish that the rice quality is not so good that they can pay 24 PHP/kg and thus they tried to buy from the farmers with as low a price as possible. However, these middle men have very small profit margin because in this year, they had to sell their rice to the millers/processor or the big traders at 24 PHP/kg as well. So, where is the profit margin for these small traders? They get a certain amount of commission which is 20 cents per kg from the traders whom they sell the rice to. That is why they try to lower their purchasing price in order to have a greater margin. If they can really establish that the rice quality is poor and therefore they can pay only 22 PHP to the farmers and on the other hand they can sell it to the millers with 24 PHP, they can have additional 2 PHP profit per kilogram. So, in total for one kilogram, they can get 2.2 PHP as profit and if they buy it with 23 PHP/kg, the profit margin becomes 1.2 PHP/kg (Detail can be seen in Table 2).
illustration not visible in this excerpt
Figure 4: Value chain analysis
To many of the farmers, the small traders profit is rational, because the traders need to make a profit too and need to cover the cost of their own capital. After the millers or the processors get the rice from the small traders, they (big traders) process them and then some of them directly give the processed rice to the retailers and some supply to the other big traders who later on sell rice to the retailers.
[...]
1 Post-graduate student of NOHA Int. Masters in Humanitarian Action at the Ruhr University of Bochum, Germany and
2 Masters in Development Studies at the University of Dhaka, Bangladesh
- Quote paper
- M. Mizanur Rahman (Author)Tasfi Sal-sabil (Author), 2016, You reap what you sow? Reasons for low profit margins among smallholding rice farmers in the Philippines, Munich, GRIN Verlag, https://www.grin.com/document/321326
Similar texts
Publish now - it's free

Comments