Excerpt
Contents
Introduction
1. Reductive Biocatalysis with whole Cells
2. Stability of nicotinamide dinucleotide cofactors
3. NAD+ Biosynthesis and Recycling
4. Aims of this Thesis
Material and Methods
1. Organisms and Plasmids
2. Chemicals and Reagents
3. Growth Media, Buffers and Additives
4. Gene Expression in E. coli
5. DNA Isolation
6. Quantitation of DNA Concentrations
7. DNA Restriction and Ligation
8. Agarose Gel Electrophoresis
9. Isolation of E. coli Membrane Proteins
10. SDS Polyacrylamide Gel Electrophoresis
11. Identification of Proteins with MALDI-TOF Mass Spectrometry
12. Polymerase Chain Reaction (PCR)
13. DNA Sequencing
14. Inactivation of NADH pyrophosphatase gene yrfE in E. coli BL21(DE3)
15. Inactivation of NADH Pyrophosphatase Gene yjaD in E. coli BL21(DE3) and Genomic Integration of pncB
16. Competent cells and DNA transfer
17. Solubilisation of Cells
18. Quantitation of Enzyme Activity and Protein Concentration
19. Quantitation of intracellular NAD(H) Concentrations
20. Quantitation of Fructose and Mannitol via HPLC
21. Quantitation of Ketones and Chiral Alcohols with Gas Chromatography
22. Determination of Intracellular Mannitol Concentration
23. Determination of intracellular pH of E. coli
24. Whole Cell Biotransformation
25. Quantitation of Fructose and Mannitol Transport
Results
1. Enhancement and Stabilization of the NAD(H) Pool in E.coli
1.1 NAD(H) Degradation in E. coli
1.2 Deletion of NADH Pyrophosphatase Genes yrfE and yjaD
1.3 Overexpression of genes within the NAD(H) recycling pathway
1.4 Genomic Integration of pncB
1.5 Overexpression of Anorganic Pyrophosphatase ppa
1.6 Overexpression of Genes nadB and nadA from the NAD(H) de novo Synthesis
2. Influence of an increased NAD(P)(H) Pool on the Productivity of Whole Cell Biotransformations
2.1 Mannitol Productivity of NADH Pyrophosphatase Mutant Strains
2.2 MannitolPproductivity with Plasmid bound Overexpression of pncB
2.3 Mannitol Productivity after Genomic Integration of pncB
2.4 Mannitol Productivity by Overexpression of Genes pncB and nadE
2.5 Case study 2: Influence of NAD(P)(H) Pool Size on the Reaction Rate of Methyl Acetoacetate to (R)-Methyl-3-Hydroxybutanoate
2.6 Case Study 3: Influence of the NAD(H) Pool Size on Productivity in a Biotransformation System of Formate Dehydrogenase and Alcohol Dehydrogenase
3. Reasons for the Decrease of intracellular NAD(H) Concentration in Fructose Mannitol Biotransformation
3.1 Detection of extracellular NAD(H) during Biotransformation
3.2 Influence of Formate on Stability of the NAD(H) Pool
3.3 Participation of Formate Dehydrogenase in Cell Permeabilization
3.4 Influence of CO2 Production and Expression of glf on Cell Integrity
3.5 Influence of Mannitol Formation on Cell Permeabilization
3.6 Cloning of a putative Mannitol Permease from Leuconostoc pseudomesenteroides
3.7 Determination of intracellular Mannitol Concentrations in Cells Expressing ORF
3.8 Cloning and examination of a putative permease from Leuconostoc pseudomesenteroides
3.9 Biotransformation with expression of fupL
Discussion
1. NAD(H) Turnover in Resting Cells of Escherichia coli
2. Overexpression of Genes from the NAD(H) Synthesis Pathway
3. Influence of an enhanced NAD(P)(H) Pool on the Reductive Biotransformation
4. Characterization of FupL and its beneficial effect on biotransformation
Literature
Introduction
1. Reductive Biocatalysis with whole Cells
The interest in enzymatic substrate conversion in industrial processes rises rapidly nowadays (Faber, 2000; Koeller and Wong, 2001; Schmid, et al., 2001; Zhao, et al., 2002). Oxido reductases which catalyze the asymmetric reduction of carbonyl groups to alcohols and amines or the oxygenation of carbon-hydrogen-bondages are in the focus of chemical industries (Li et al., 2002; Stewart, 2001).
The employment of whole cells instead of isolated enzymes is advantageous since a laborious purification of enzymes is avoided and the product can be separated by the product without ease (Buchholz and Gröger, 2006). Often enzymes are more stable in their natural environment. Finally, cells possess a natural cofactor pool; employing isolated enzymes often requires the addition of cofactors increasing the process costs. Most oxido reductases require pyridine nucleotides as cofactors. By using isolated enzymes a stoichiometric addition of NAD(P)H would not be reasonable for economic considerations (van der Donk and Zhao, 2003). That is why a cofactor consuming reaction is always coupled to a cofactor regenerating reaction in industrial processes. Either this redox reaction can be catalyzed by one enzyme alone or the cofactor regenerating reaction has to be catalyzed by a second enzyme (Buchholz and Gröger, 2006). The reduction of ketones to chiral alcohols by alcohol dehydrogenase from Lactobacillus brevis is an example for a mono-enzymatic catalysis. Thereby, the regain of cofactor NADPH is guaranteed by the oxidation of isopropanol. The alcohol dehydrogenase from L. brevis is tolerant to high solvent concentrations and is characterized by a high specific enzyme activity (Schubert et al., 2002). In coupled enzyme processes often formate dehydrogenase from Candida boidinii (Bommarius et al., 1994; Bommarius et al., 1998) or Mycobacterium vaccae N10 (Kaup et al., 2004) glucose dehydrogenase from Bacillus subtilis (Zhang et al., 2006) and phosphate dehydrogenase from Pseudomonas stutzeri (Costas et al., 2001; Vrtis et al., 2001) are used form cofactor regeneration. An advantage of formate dehydrogenase over other cofactor regenerating enzymes is the volatility of the reaction product CO2. Hence, reactions are driven to product for thermodynamic reasons and a separation of main products from by-products is prevented.
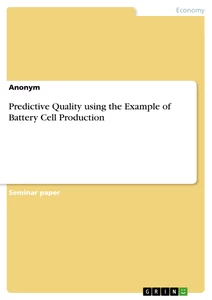
A possible disadvantage of using whole cells for biocatalysis emerges by the presence of a cell membrane, which separates substrate from enzyme. This for most substrates invincible barrier has often to be permeabilized to allow passage of the substrate. This permeabilization results in a loss of intracellular cofactors. Partially the transport of substrate can be facilitated by the expression of specific transporter genes. This approach was successful for the biotransformation of fructose to mannit by whole cells of E. coli. Since fructose is taken up by the phosphotransferase system (Kornberg et al., 2000), fructose is present in E. coli in unphosporylated form which is no substrate for the mannitol dehydrogenase from Leuconostoc pseudomesenteroides. By overexpression of a glucose facilitator gene from Zymomonas mobilis an influx of fructose into the cell driven by a concentration gradient was enabled (Kaup et al., 2004).
illustration not visible in this excerpt
Fig. 1: Scheme of a recombinant E. coli strain fort he production of mannitol from
fructose. The cofactor NADH is regenerated by the reduction of formate.
GLF: Glucose facilitator protein from Zymomonas mobilis.
2. Stability of nicotinamide dinucleotide cofactors
The reduced as well as the oxidised form of pyridine nucleotides are instable in aqueous solutions. While NAD(P)H is stable in alkaline solutions NAD(P)+ is stable in acidic environment (Lowry et al., 1961; Wong and Whitesides, 1981). Nucleophilic reagents as phosphate can induce a degradation of NAD(P)+. Phosphate concentrations as present in cells can cause the degradation of 50 % of intracellular NAD(P)+ within 50 h in resting cells of E. coli (Wong and Whitesides, 1981). However, enzymes which metabolize NAD(P)+, are considered to be mainly responsible for the instability of the pyridine nucleotide pool. NAD+ pyrophosphorylases and phosphatases contribute to 80 % of the NAD+ degrading enzymatic activity foand in crude extract of yeast (Takei et al., 1966). The stability of pyridine nucleotides differs from organism to organism. Normally the half life of NAD(H) is 10 to 50 h in growing cells. Furthermore, the stability is dependent from cultivation conditions (temperature, carbon source etc.) (Schütz, 1984). Enzymes, which are responsible for NAD turnover, were studied in detail in Salmonella typhimurium (Park et al. 1988, Park et al. 1989, Falconer et al. 1984). In crude extracts the activity of a NAD pyrophosphatase is mainly responsible for the degradation of NAD(H). After deletion of gene pnuE encoding for a NAD pyrophosphatase no more NAD pyrophosphatase activity was detected in crude extract. However, the deletion of the gene had no impact on the NAD(H) turnover of whole cells (Park et al. 1988). The NAD pyrophosphatase from S. typhimurium is associated to the cell membrane and is presumably responsible for the uptake of extracellular NAD(H) (Falconer et al. 1984). The NAD pyrophosphatase is the decisive enzyme fort he recycling of the purine residue of NAD, mutants lacking this enzyme cannot grow on NAD as sole purine source (Park et al. 1988). Furthermore, the NAD dependent DNA ligase was supposed to be most responsible for NAD(H) turnover in S. typhimurium (Falconer et al. 1984). However, the substitution of the gene by an ATP dependent DNA ligase of phage T4 had no significant influence on NAD(H) turnover (Park et al. 1989). By now it is not known which enzyme is responsible for the NAD(H) turnover in S. typhimurium. The observation that the half-life time of NAD(H) differs when the cells are grown ander aerobic or anaerobic conditions could give a hint for the function of NAD(H) turnover. In S. typhimurium grown ander aerobic conditions the half-life time of NAD(H) is 90 min but 330 min ander anaerobic conditions. Hence, NAD(H) turnover could coincide with a protection of the cell from toxic oxygen harming membrane or DNA (Park et al., 1989). S. typhimurium as well as E. coli are able to use exogenous NAD but there are seemingly significant differences in the degradation of NAD (Park et al. 1988). In E. coli nicotinamide mononucleotide, a degradation product of NAD pyrophosphatase, is never accumulated. That is why it was supposed that NAD is mainly cleaved to ADP-ribose and nicotinamide by glycohydrolases and later on hydrolyzed to nicotinic acid (Ferro and Olivera, 1987; Foster and Moat; 1980). However, no activity of a NAD glycohydrolase could be detected in E. coli (Penfound and Foster, 1996). In contrast to other authors (Ferro and Olivera, 1987; Foster and Moat; 1980) Hillyard et al. (1981) suggest that NAD turnover E. coli is catalyzed mainly by NAD pyrophosphatases. The fact that nicotinamide mononucleotide, degradation product of NAD pyrophosphatases, does not accumulate in E. coli (Park et al. 1988) could be correlated to high in vivo activities of the enzymes nicotinamide mononucleotide deamidase and nicotinamide mononucleotide glycohydrolase metabolizing nicotinamide mononucleotide.
3. NAD+ Biosynthesis and Recycling
The cofactors NAD(H) and NADP(H) are involved in 17 % of all enzymatic classified reactions (You, 1985). Apart from its role in redox reactions NAD(H) is involved in DNA ligation (Gellert et al., 1968; Olivera et al., 1968), ADP ribosylation of proteins (Moss et al., 1979), protein deacetylation (Starai et al., 2002) and vitamin B12 biosynthesis (Maggio-Hall and Escalante-Semerena, 2003).
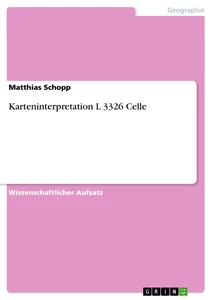
In the de novo synthesis of NAD(H) in E. coli aspartate is oxidised to α-iminosuccinate by an aspartate oxidase (gene product of nadB) in the first step and FAD is reduced to FADH2. α-iminosuccinate is condensed with dihyroxyacetone phosphate to quinolinate by a quinolinate synthase (gene product of nadA). A quinolinate phosphoribosyltransferase (encoded by nadC) transfers a ribose residue from phosphoribosyl pyrophosphate quinolinate and nicotinic acid mononucleotide is generated. By the action of nicotinic acid mononucleotide adenylyltransferase (gene product of nadD) an adenylyl residue is transferred from ATP to nicotinic acid mononucleotide resulting in the formation of nicotinic acid adenine dinucleotide. In the last step, NAD is formed by the ammonification of the nicotinic acid residue. This reaction is catalyzed by a NAD synthase encoded by gene nadE (Penfound and Foster, 1996). The de novo synthesis is regulated by an end product repression by NAD. If sufficient NAD is present, NAD binds to the regulator protein NadR that binds to the operator regions of genes nadB and nadA and represses their expression (Penfound and Foster 1999) (Fig. 2).
NAD de novo synthesis starting substrate is aspartate in most bacteria (Penfound and Foster 1996). In contrast, NAD de novo synthesis starts with tryptophane in eukaryotes (Rongvaux et al. 2003). Nevertheless, there are also bacteria known using tryptophane for NAD synthesis (Kurnasov et al. 2003).
illustration not visible in this excerpt
Fig. 2: Metabolic pathway for the de novo synthesis of NAD in bacteria.
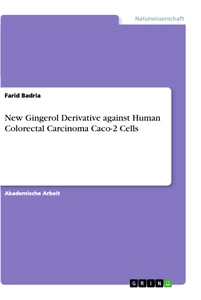
The existence of a pyridine nucleotide cycle supplying de novo synthesis with debris from NAD degradation was proposed first by Gholson (1966). Penfound and Foster (1996) differ three different cycles of NAD recycling. In vivo experiments stated that 80% to 90% of intracellular NAD is recycled via the pyridine nucleotide cycle IV that degrades and resynthesizes NAD in four enzymatic steps (Andreoli et al., 1969; Foster et al., 1980; Hillyard et al., 1981; Manlapaz-Fernandez and Olivera, 1973): At first NAD is cleaved by a pyrophosphatase to nicotinamide mononucleotide and AMP. Nicotinamide mononucleotide is converted to nicotinic acid mononucleotide by cleaving of ammonium by a deamidase. Nicotinic acid mononucleotide is precursor for the production of NAD by catalysis of gene products nadD and nadE.
In pyridine nucleotide cycles V and VI NAD recycling starts with nicotinic acid mononucleotide. Cycle VI consists of six enzymatic steps whereby NAD is cleaved to nicotinamide mononucleotide and AMP by pyrophosphatases first. Then nicotinamide mononucleotide is cleaved to nicotinamide and ribose-5-phosphate via a glycohydrolase. Nicotinamide is converted to nicotinic acid by a deamidase. Nicotinic acid is ribosylated to nicotinic acid mononucleotide by a nicotinic acid phsophoribosyl transferase consuming ATP (Penfound and Foster, 1996). Cycle V differs from cycle VI by the fact that NAD is cleaved to nicotinamide and ADP-ribose by a glycohydrolase instead of a pyrophosphatase (Fig. 3).
illustration not visible in this excerpt
Fig. 3: NAD can be recycled by four different pathways, pyridine nucleotide cycle IV (red), cycle V (green), -cycle VI (blue). NadD: Nicotinic acid adenylyl transferase; NadE: NAD synthase; PncA: Nicotinamide deamidase; PncB: Nicotinic acid phosphoribosyl transferase; PncC: Nicotinamide mononucleotide deamidase; NMN: Nicotinamide; PPRP: Phosphoribosyl pyrophosphate; PPi: Pyrophosphate; Pi: Phosphate.
The recycling pathway of NAD is controlled by the regulator protein NadR as well (Penfound and Foster, 1996). NAD binds to NadR inducing a change in conformation, which enables binding of NadR to the operator region of pncB (Grose et al., 2005). The affinity of the operator of pncB is six fold lower than the operator of nadA (Penfound and Foster, 1999). This means that recycling of the nicotinic acid residue is favoured to NAD de novo synthesis. The expression level of pncB is the switch fort the intracellular NAD(H) concentration. By overexpression of this gene the intracellular NAD(H) concentration is increased (Wubbolts et al., 1990; San et al., 2002). The influence of expression intensity of genes nadD and nadE on the intracellular NAD(H) concentration is not known so far.
The course of NAD turnover in E. coli could not be clarified so far. Hillyard et al. (1981) argue for a degradation of NAD mainly by NAD pyrophosphatases. By now two genes were annotated in E. coli coding for NAD(H) pyrophosphatases : yrfE and yjaD. Features of YjaD are a high preference for NADH with a fifty fold lower KM than for NAD+. The specific activity of the purified enzyme is 7.6 units mg-1 protein (Frick and Bessman, 1995). The specific activity of purified YrfE is 21 units mg-1 protein (O'Handley, et al., 1998). There are no data available how the deletion of these genes affect the stability of NAD(H) in resting cells and the activity of NADH pyrophosphatases in crude extracts of E. coli.
4. Aims of this Thesis
For the biotransformation of fructose to mannitol with strain E. coli BL21(DE3) pET24a(+)- fdh - mdh; pZY507- glf it could be shown that the intracellular concentration of cofactor NAD decreases dramatically within a few hours after start of the process (Kaup, 2004). Aim of this thesis was to find out the reasons for the decline of the NAD(H) pool and to develop strategies to prevent this decline. Firstly, NAD(H) metabolizing enzymes were supposed to be responsible for the decrease of the NAD(H) pool. Consequently, these genes should be deleted in E. coli. Secondly, by overexpression of genes of the NAD(H) synthesis pathway NAD(H) synthesis should be enforced. Finally it should be studied if an increased NAD(H) pool could contribute to a rise in productivity and prolong long-term stability of biotransformation process.
Material and Methods
1. Organisms and Plasmids
Following strains were used in this work:
Tab. 2.1: Strains of Escherichia coli used in this work.
illustration not visible in this excerpt
Deletion mutants of genes yjaD and yrfE were constructed in strain E. coli BL21(DE3). Furthermore, a mutant was constructed by integrating gene pncB in place of gene yjaD (Tab. 2.2).
illustration not visible in this excerpt
Tab. 2.2: Mutants of E. coli BL21(DE3) constructed in this work.
Plasmids used in this work are listed in table 2.3.
illustration not visible in this excerpt
Tab. 2.3: Plasmids used in this work.
Plasmids Features Application Reference
Following oligonucleotides were used in this work (Tab. 2.4):
illustration not visible in this excerpt
Tab. 2.4: Oligonucleotides used in this work are listed in 5’-3’ direction. Restriction sites are anderlined. Complementary DNA regions are given in italics.
2. Chemicals and Reagents
Chemicals of companies Merck KGaA (Darmstadt, Germany), Sigma Chemie (Deisendorf, Germany) and Difco Laboratories (Detroit, USA) were used in p.A. quality. Biochemicals and enzymes were purchased from Roche Diagnostics (Mannheim, Germany), New England Biolabs (Frankfurt, Germany) and Invitrogen (Karlsruhe, Germany). Strains Escherichia coli BL21(DE3) and Tuner(DE3) were from Novagen (EMD Biosciences, Inc., Novagen Brand, Madison, USA), E. coli strain DH5a was supplied by Invitrogen (Karlsruhe, Germany). Plasmids pET24a(+), pCDF-Duet1 and pRSF-Duet1 were purchased from Novagen (EMD Biosciences, Inc., Novagen Brand, Madison, USA). Plasmid pUC19 derived from Fermentas (Leon-Rot, Germany). DNA ladders were ordered from Promega (Madison, USA). Oligonucleotides were synthesized by Operon (Cologne, Germany).
3. Growth Media, Buffers and Additives
E. coli was grown in Luria-Bertani (LB) medium (Miller, 1972). Gene expression in E. coli was induced by growing the cells in lactose containing „Overnight-Express-Medium“ (Novagen). For growth under defined conditions, MOPS supplemented defined medium from TEKnova (USA), a modified medium as described by Neidhardt et al. (1974). Per litre of defined medium 100 ml of a MOPS buffered solution, 10 ml of a 0.132 M di-potassium phosphate solution, 100 ml of a nucleic bases containing solution, 40 ml of a supplement solution and 10 ml of a 40 % (w/v) glucose solution were mixed with 740 ml distilled water. The composition of the MOPS buffered medium, the nucleic bases containing solution and the supplement solution is depicted in table 2.5. All the solutions were shelved at -20°C.
For storage of DNA and protein extracts and for electrophoresis of them buffers were used as described by Sambrook et al. (2000).
illustration not visible in this excerpt
Tab. 2.5: Components used for the compilation of MOPS supplemented defined medium.
The solutions were united, filled up to 2 litres with distilled water and sterile filtered.
For selection of antibiotics resistent E. coli strains antibiotics were added to growth media in following concentrations (Tab. 2.6):
illustration not visible in this excerpt
Tab. 2.6: Antibiotics added to media for selection of E. coli.
4. Gene Expression in E. coli
For gene expression via lactose inducable promoters either isopropyl thiogalactoside (IPTG) was added to LB medium (Donovan et al., 1996) or a lactose containing commercial induction medium (Novagen) was used. For induction of gene expression in LB medium a main culture was inoculated to an OD600 of 0.1 by an over-night preculture. Reaching OD600 of 0.5 700 µM IPTG was added. Using E. coli Tuner (DE3) lower amounts of IPTG were added (final concentration 50 – 200 µM) to weaken gene expression. The expression of homologous genes of E. coli was induced at 37°C and 170 rpm for 4 h, the expression of heterologous genes (fdh, mdh, glf, fupL) was induced at 27 °C and 170 rpm for 4 h (Kaup, 2 004). The „Overnight Express Medium“ was prepared as recommended by the manufacturer (Novagen). About ten single colonies were resuspended in 50 ml of that medium and cell growth was performed as described above. For complete gene expression, 16 h were normally sufficient.
5. DNA Isolation
Plasmid isolation was performed with the Qiaprep Spin Miniprep Kit (Qiagen, Hilden). The purification of PCR products and DNA fragments was performed either with the QiaexII Gel Extraction Kit or the High Pure PCR Product Purification Kit (Roche Diagnostics, Mannheim, Germany).
6. Quantitation of DNA Concentrations
DNA concentrations were determined at a wave length of l = 260 nm (NanoDrop ND-1000, Peqlab, Erlangen, Germany). The pureness was determined by the ratio of E260/E280 (contamination by protein) and E260/E230, whereas a ratio between 1.8 and 2.0 indicated a high pureness (Gallagher and Desjardins 2007).
7. DNA Restriction and Ligation
DNA which had to be restricted was mixed with 0.1 volume of buffer from the manufacturer (10 x concentrated). Per µg of DNA 2 – 10 U of enzyme were added. The percentage of enzyme solution in the assay should not exceed 10 % (v/v) because of high glycerine concentrations in the enzyme solution. The assay was incubated for 1 – 4 h at the temperature indicated for the enzyme by the manufacturer.
For a typical ligation ca. 200 ng PCR product, ca. 50 ng plasmid DNA, T4 DNA ligase buffer and T4 DNA ligase were mixed to a final enzyme activity of 1 U. Sterile water was added to a final concentration of 10 µl and the mixture was incubated at 4 °C over night (Mülhardt 2000).
8. Agarose Gel Electrophoresis
Agarose gels contained 1% Agarose (w/v). Tris acetate EDTA was used as buffer at pH 7.5. Five parts of DNA solution were mixed with one part of loading buffer (Fermentas) and applicated to the gel. Electrophoresis was performed at a voltage of 100 V. Subsequently the gel was stained in an ethidiume bromide solution (2.0 µg ml-1, 20 min) and distained in H2O (ca. 10 min). DNA became visible under UV light and was photographed (Image Master® VDS-System, Amersham Pharmacia Biotech, Freiburg, Germany).
9. Isolation of E. coli Membrane Proteins
10 ml of over night culture grown in “Overnight Express Medium“ (Novagen) was centrifuged in 50 ml Falcon Tubes (4 min, 8,000 rpm, 4°C) and washed with 5 ml Tris/HCl, pH 7.5. After a second centrifugation step the cells were resuspended in 1 ml 30 mM Tris/HCl, pH 8.0 and transferred in a 1.5 ml Eppendorf tube. Afterwards cells were disrupted by sonification (UP 200 S, Dr. Hielscher GmbH, Teltow, Germany; Amplitude 60 %; Cycle 0.6) for 6 min. After sedimentation of cell debris (15 min, 15,300 rpm, 4°C) the supernatant was centrifuged at high speed (60 min, 45,000 rpm, 4°C, Beckmann 50 TI-Rotor). Membrane fragments settled at the bottom of the tube and were washed in 1 ml 1 M potassium acetate. After a second centrifugation at high speed membrane proteins were solubilised in 200 µl 1 % tritone X-100; 10 mM Tris/HCl, pH 7.5 and resuspended carefully. The protein concentration was determined by the method of Bradford (1976).
10. SDS Polyacrylamide Gel Electrophoresis
Proteins from cell crude extract were separated in a polyacrylamide gel to verify if cloned genes were expressed. Proteins were boiled for three min in 0.1 mg ml-1 bromine phenol blue, 8 % SDS, 40 % glycerine, 40 mM DTT and 250 mM Tris/HCl, pH 6.8 in H2O (Laemmli, 1970). SDS polyacrylamide gels consisted from a collection gel (4 % acryl amide w/v, pH 6.8) and a separation gel (11.5 % acryl amide w/v, pH 8.9) (Laemmli, 1970). Proteins were concentrated in the collection gel at 10 mA and separated in the separation gel at 20 mA. Staining of the gels was performed with Page BlueTM Protein Staining Solution (Fermentas).
11. Identification of Proteins with MALDI-TOF Mass Spectrometry
The identification of proteins was conducted via peptide mass fingerprint analysis (Fountoulakis and Langen, 1997; Nouwens et al., 2000; Schaffer et al., 2001). Therefore, protein lanes were cut from the gel and washed twice in 30 % (v/v) acetonitrile in 0.1 M NH4HCO3 for 15 min and dried for 20 min in a vacuum centrifuge. The gel pieces were rehydrated in 2 ml 3 mM Tris/HCl, pH 8.8 with 10 ng µl-1 trypsine for 30 min. Subsequently 4 µl of 3 mM Tris/HCl, pH 8.8 were added and the mixture was incubated at room temperature over night. The elution of tryptically cleaved peptides from the gel matrix was performed by incubation in 9 µl water for 15
min followed by addition of 7.5 µl 30 % acetonitrile (v/v) in 0.1 % (w/v) tri-fluor acetic acid and further 10 min of incubation at room temperature.
0.5 µl of probe were co-crystallized with 0.5 µl of matrix (α-Cyano-4-hydroxy-trans cinnamon acid in 50 % (v/v) acetonitrile and 0.25 % (w/v) tri-fluor acetic acid) for MALDI-Tof analysis (Vorm and Mann, 1994). Calibration, detection and analysis of data were performed as described by Schaffer et al. (2001).
12. Polymerase Chain Reaction (PCR)
The “High Fidelity PCR Master Mix“ (New England Biolabs) was used for he amplification of DNA fragments. PCR was performed as indicated by the manufacturer but choosing an annealing temperature 5°C lower than the melting temperature of the primers.
13. DNA Sequencing
DNA was sequenced employing the chain disruption method of Sanger et al. (1982). Therefore, the BigDyeTerminator Kit V3.1 from Applied Biosciences (USA) was used. Labeling of oligonucleotides was resulted by fluorescence labelled nucleoside tri-phosphates in the PCR mixture. For sequencing, the same primers were used as for the amplification of the gene. After finishing the amplification process, ologonucleotides were purified with the DyeEx-Kit from Qiagen. Separation and detection of oligonucleotides was performed with the ABI Prism® 3100 Avant (Hitachi, Japan).
14. Inactivation of NADH pyrophosphatase gene yrfE in E. coli BL21(DE3)
For the inactivation of the first NADH pyrophosphatase, a marker-less deletion of the chromosomal yrfE gene was conducted. Upstream and downstream of yrfE, 500 bp were amplified using primers yrfE _upstream_fw/ yrfE _upstream_rev_ Bam HI and yrfE _downstr._fw_ Eco RI/ yrfE _downstr._rev, respectively. The inner primers yrfE _upstream_fw and yrfE _downstr._rev contained a complimentary sequence which enabled a linkage of both 500 bp fragments by extension PCR. The resulting 1 kb fragment was cloned into vector pUC19 by Bam HI and Eco RI restriction. The outer primers yrfE _upstream_rev_ Bam HI and yrfE_downstr._fw_ Eco RI both contained two I- Sce I restriction sites, which enabled an intracellular cleavage of the deletion construct from the vector pUC19 D yrfE. The deletion of yrfE was performed by lambda red genes-mediated recombination (Herring et al. 2003).
15. Inactivation of NADH Pyrophosphatase Gene yjaD in E. coli BL21(DE3) and Genomic Integration of pncB
The second NADH pyrophosphatase was inactivated by genomic integration of the pncB gene into the orf encoding yjaD. Upstream and downstream of yjaD, 500 bp were amplified using oligonucleotides yjaD _upstream_fw_ Xma I/ yjaD _upstream_rev_ Sph I_ Sac I and yjaD _downstr._fw_ Sph I_ Sac I/ yjaD _downstr._rev_ Bam HI, respectively. The inner primers yjaD _upstream_rev_ Sph I_ Sac I and yjaD _downstr._fw_ Sph I_ Sac I contained a complementary region, which allowed the linkage of both primers by extension PCR. The unified fragment harboured Sph I and Sac I restriction sites for the subsequent insertion of the pncB gene. The outer primers yjaD _upstream_fw_ Xma I and yjaD _downstr._rev_ Bam HI contained Bam HI and XmaI restriction sites for cloning into vector pKO3 (Link et al. 1997) resulting in vector pKO3 D yjaD. Gene pncB was amplified from pET24a(+) pncB including the T7 promoter region using primers pncB _fw_ Sph I and pncB _rev_ Sac I. The PCR product was restricted with Sac I and Sph I and cloned in vector pKO3 D yjaD, resulting in pKO3 D yjaD:: pncB. The deletion of yjaD was performed by homologous recombination due to selection of chloramphenicol resistance in a first step and sacB induced sucrose intolerance in a second step (Link et al. 1997).
16. Competent cells and DNA transfer
Competent cells were produced and transformed with plasmid DNA as described by Hanahan (1983). After transformation cells were incubated in SOC-Medium (Sambrook et al. 2000) to allow development of the plasmid encoded antibiotic resistance before they were selected on LB agar plates containing specific antibiotic. Alternatively, if two or three plasmids were transformed simultaneously transformation was performed via electroporation. The preparation and electroporation of the cells was performed as described by Dower et al. (1988). For electroporation cuvettes with a diameter of 2 mm were used (Biorad, Germany). Electroporation was conducted with a MicroPulserTM from Biorad using a voltage of 2.5 kV.
17. Solubilisation of Cells
Cell pellets were resuspended in the same buffer which was later on used for the enzyme assay and solubilised by sonification by cooling with ice for 4 min (Cycle of sonification 0.5; amplitude 55). The sonifier UP200S from Hielscher Ultrasonics GmbH (Stuttgart, Germany) was employed. After solubilisation, the cells were cooled on ice. Separation of cell extract from debris was performed by centrifugation at 20,000 g and 4°C for 6 min. The cell extract was us ed to analyse enzyme activities. If salt concentrations were inhibitive for the enzyme assay the crude extract was desalted with a PD-10 column according to the instructions of the manufacturer (Amersham Biosciences, United Kingdom).
18. Quantitation of Enzyme Activity and Protein Concentration
Enzyme activity was indicated in Units (U) whereby one U was equal to one i.tmol of converted substrate per minute. The specific activity is indicated in U mg-1 protein. The spectrophotometer DU640 from Beckman (USA) was used for photometric analysis.
NADH pyrophosphatase activity was quantitated by incubating the crude extract in 50 mM Tris/HCl buffer, pH 8.5, 20 mM MgCl2 and 2 mM NADH at 37 °C (Frick and Bessman, 1995). After 0, 10, 20 and 30 min probes were taken from the assay and enzyme was inactivated by heat (95°C). Precipitated protein was removed by centrifugation (10 min, 13,000 rpm) and the supernatant was cleared from micro particels by filtering (Millipore sterile filter, pore size 0.2 i.tm). AMP released during hydrolysis of NADH was quantitated by HPLC (Frick and Bessman, 1995).
Nicotinic acid phosphoribosyl transferase activity was measured following the formation of ADP. The reaction mixture contained 4.5 mM ATP, 1.5 mM phosphoribosyl pyrophosphate, 45 mM potassium phosphate, pH 7.5, 45 mM Tris-HCl, pH 7.5, 15 mM MgCl2, 0.15 mM nicotinate (Vinitsky and Grubmeyer, 1993), 4 mM phosphoenolpyruvate, 0.2 mM NADH, 13 U lactate dehydrogenase, and 13 U pyruvate kinase. The reaction was started by the addition of nicotinate. The concomitant consumption of NADH (e340nm = 6.3 mM–1 cm–1) was monitored photometrically.
The assay of NAD synthetase activity was modified from the method of Nessi et al (1995). The reaction mixture contained 2 mM ATP, 1 mM nicotinic acid dinucleotide, 20 mM KCl, 10 mM MgCl2, 1 mM (NH4)2SO4, and 50 mM Tris-HCl, pH 8.5. The formation of NAD+ was measured photometrically as described (see below).
Nicotinic acid mononucleotide adenylyltransferase assay was performed as described by Mehl et al. (2000). Nicotinic acid mononucleotide (NaMN) and nicotinamide adenine dinucleotide (NaAD) were identified by the HPLC method as described (Mehl et al. 2000).
The assay of inorganic pyrophosphatase was performed in 50 mM Tris-HCl, pH 8.0, containing 4 mg/mL MgSO4 x 7 H2O, 7.5 mg/mL KCl, and 2 mM pyrophosphate (Heinonen and Lahti, 1981). Phosphate released was detected with the EnzChek Phosphate Assay kit by Invitrogen. Phosphate was enzymatically coupled to 2-amino-6-mercapto-7-methyl-purine ribose, which resulted in a colorimetric shift from 330 nm to 360 nm, which was monitored photometrically (Webb, 1992).
Alcohol dehydrogenase was tested in 0.1 M potassium phosphate buffer, pH 6.5, containing 1 mM MgCl2, 10 mM methyl acetoacetate and 0.25 mM NADPH. Glucose dehydrogenase activity was determined in the same buffer, containing 0.2 M glucose and 2 mM NAD+. The formation/consumption of NAD(P)(H) (e340nm = 6.3 mM-1 cm-1) was monitored photometrically.
The specific activity of mannitol dehydrogenase from L. pseudomesenteroides ATCC 12291 was determined by oxidation of NADH to NAD+ with fructose as substrate (Hahn, et al. 2003; Schneider and Giffhorn, 1989). The assay contained 100 mM KPi buffer, pH 6.5, 200 µM NADH and 200 mM fructose.
Formate dehydrogenase from M. vaccae N10 was tested by detecting the reduction of NAD+ to NADH (Galkin et al., 1995; Schütte et al., 1976). The assay contained 100 mM KPi buffer, pH 6.5, 2 mM NAD+ and 200 mM sodium formate.
The protein concentration of crude extract was determined by the method of Bradford (1976) using the commercial Biorad Protein Assay Kit.
19. Quantitation of intracellular NAD(H) Concentrations
Intracellular pyridine nucleotide concentrations could either be detected by HPLC or by an enzymatic method.
Enzymatic procedure: Pyridine nucleotides were determined by a kinetic photometric method according to Bernofsky and Swan (1973), (modified by San et al. 2002 and Moritz 2000). The samples were internally standardized as described above (HPLC analysis). E. coli cells were disrupted by sonification (4 min, 4 °C) and cell debris was removed by centrifugation (20,000 × g for 1 h at 4 °C). 50 µL of the supernatant were subjected to photometric NAD(H) and NADP(H) determination in a cuvette containing 300 µL water and 600 µL of the reaction mixture (0.2 M Bicine, pH 8.0, 16% ethanol, 13 mM EDTA, 1.4 mM 3-[4,5-dimethylthiazolyl-2-yl]-2,5-diphenyltetrazolium bromide (MTT), and 5.5 mM phenazine ethosulphate (PES)). In the case of NADP(H) determination, ethanol was substituted by 50 mM glucose-6-phosphate. The reaction was started by the addition of 50 µL yeast alcohol dehydrogenase III (45 U/mL) for NAD(H) determination and 50 µL glucose-6-phosphate dehydrogenase (10 U/mL) for NADP(H) determination, respectively. NADH/NADPH was oxidized by PES and NAD+/NADP+ were reduced by alcohol dehydrogenase in a redox cycle. Reduced PES transferred its electrons on MTT, which resulted in the formation of formazan (absorption maximum 570 nm). The velocity of formazan formation depended on the NAD(P)(H) concentration of the sample. NAD(H) and NADP(H) concentrations were calculated using a calibration curve which was run with each assay. Internal standardization with NAD+ and NADP+, respectively, was conducted for each determination.
[...]
- Quote paper
- Florian Heuser (Author), 2007, Increasing the Productivity of Whole Cell Biotransformation by Enhancing the intracellular NAD(H) Concentration, Munich, GRIN Verlag, https://www.grin.com/document/137750
Similar texts


Publish now - it's free

Comments